Developer Tooling
Configuring a Datadog Pipeline for Parsing Request Headers


In the realm of data analysis and monitoring, having a streamlined pipeline for handling logs is essential. Datadog provides a powerful platform for monitoring and analyzing logs, and configuring a pipeline with a Grok processor can significantly enhance your log parsing capabilities.
In this guide, we'll walk through the steps of setting up a Datadog pipeline and adding a Grok processor to parse request headers using a specific parsing rule. Additionally, we'll explore how to leverage the parsed logs to create facets, facilitating searching and grouping queries.
Setting up the Datadog Pipeline
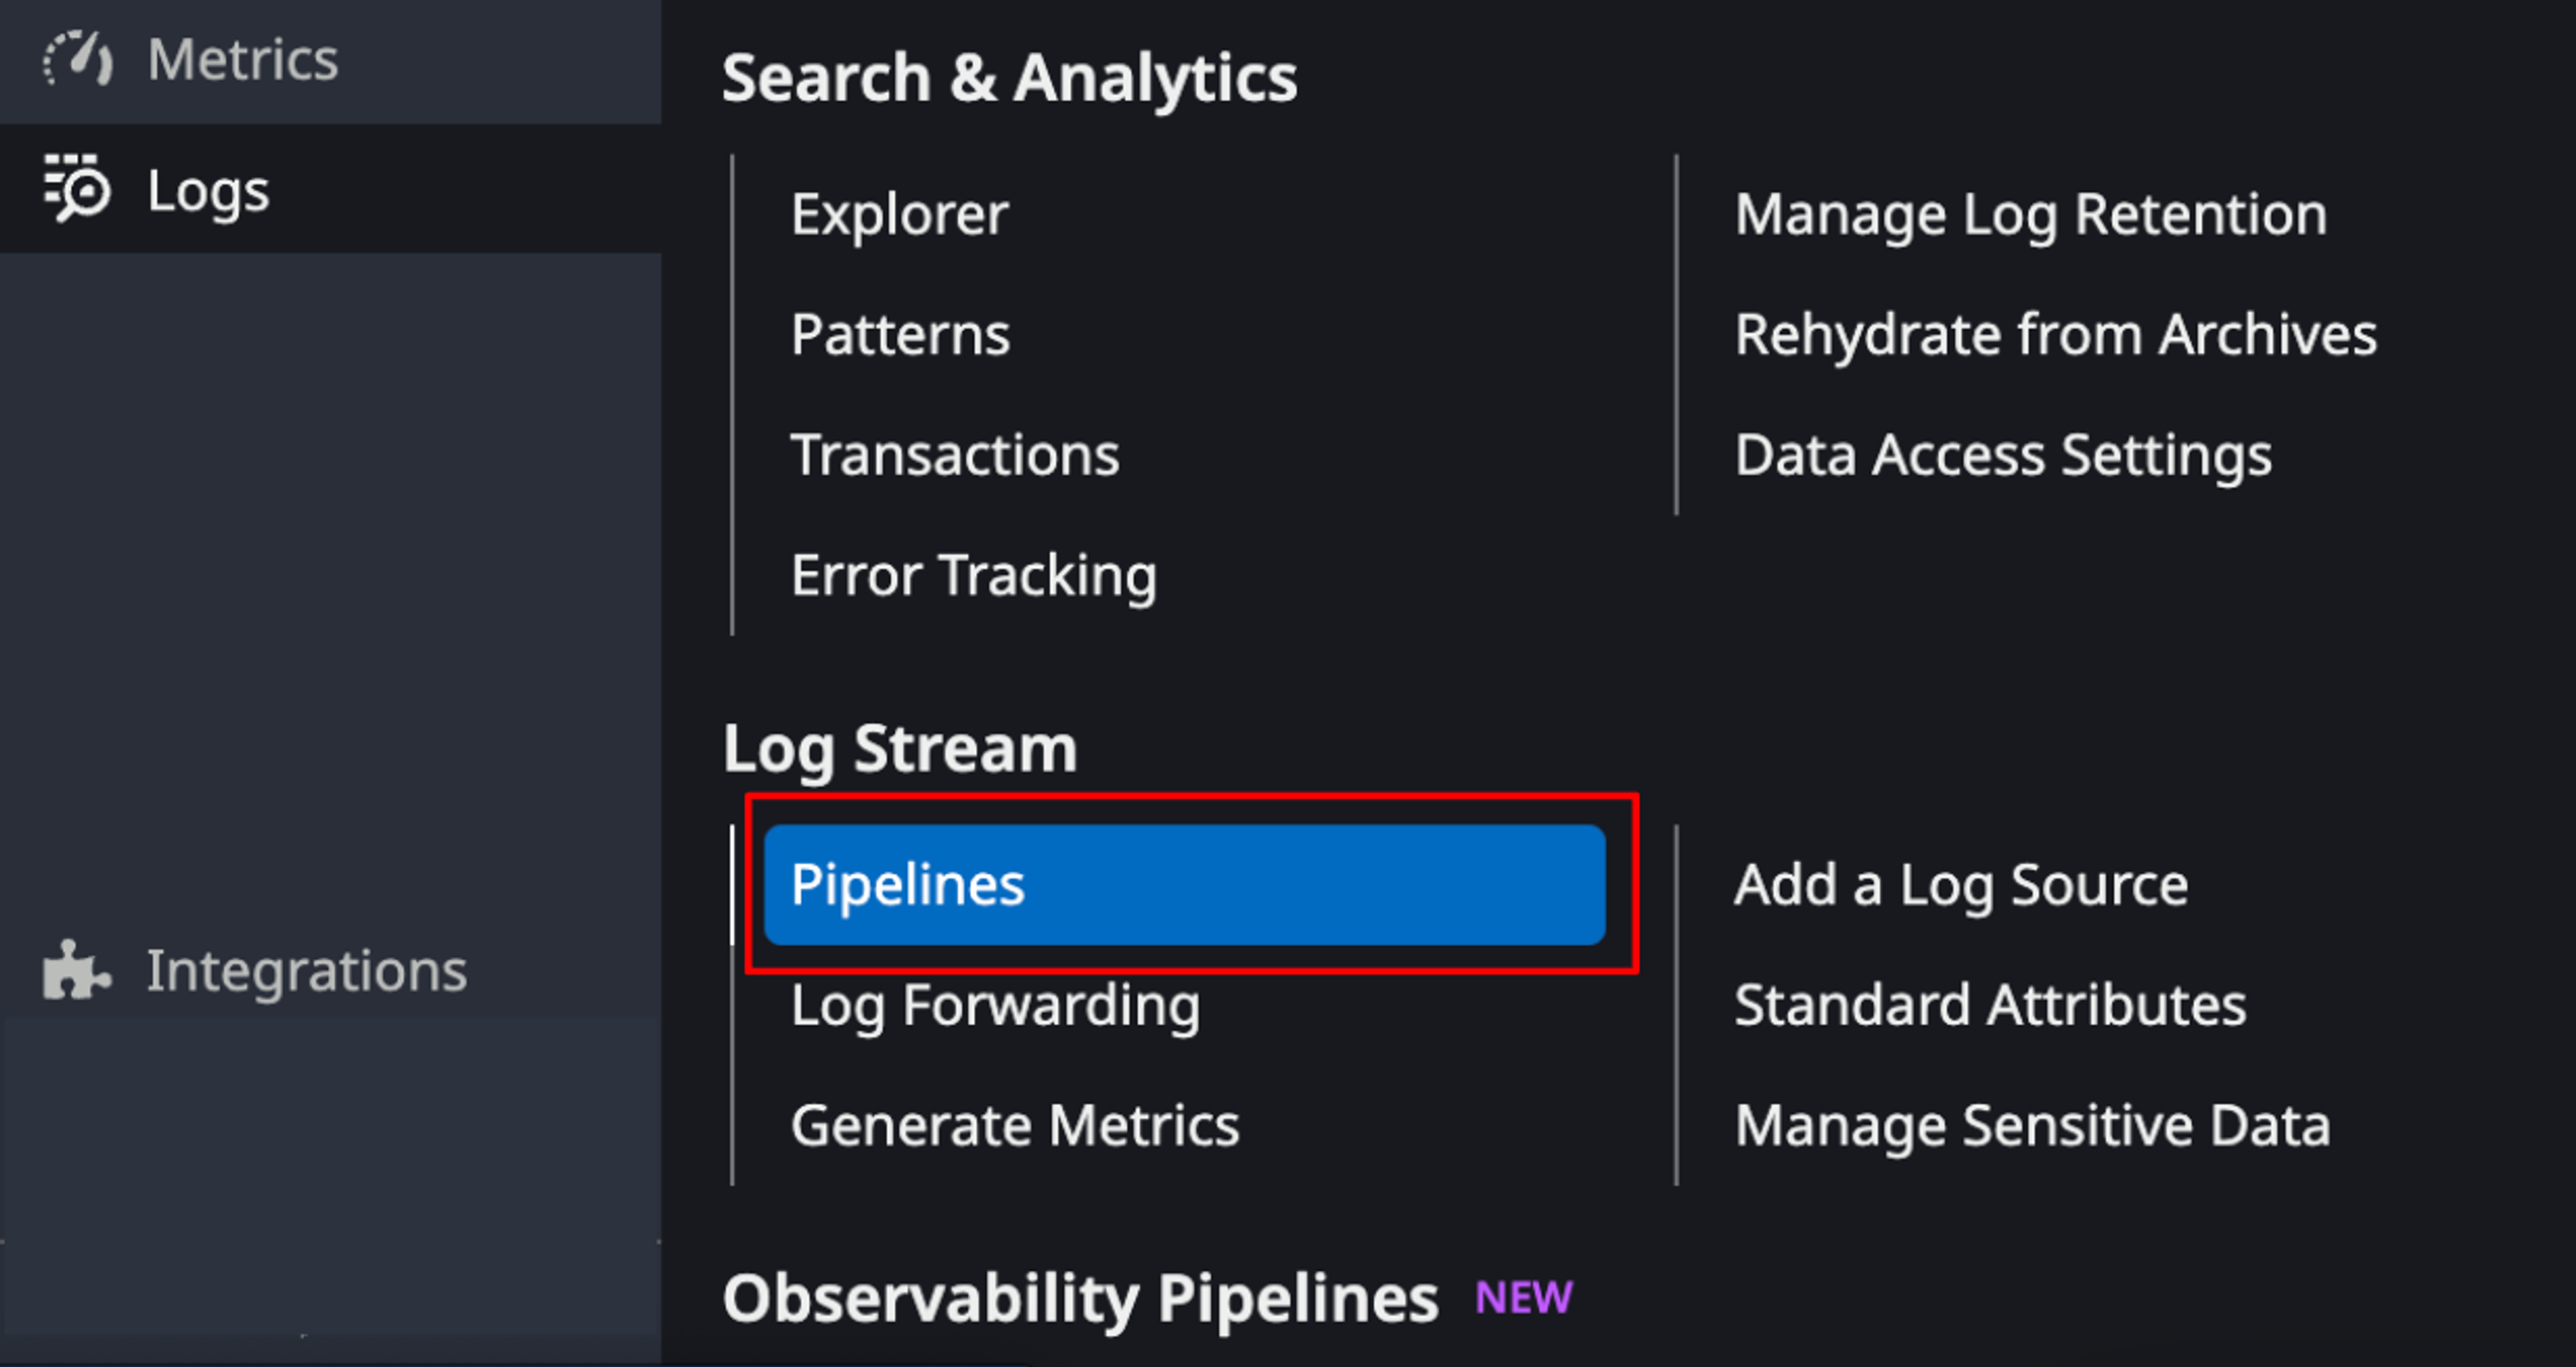
1. Access Datadog Dashboard: Log in to your Datadog account and navigate to the Logs section.
2. Create a New Pipeline: Click on the "Pipelines" tab and then click "New Pipeline."

3. Define Pipeline Stages: Define the stages of your pipeline, such as filters, processors, and outputs. For our purpose, we'll focus on adding a Grok processor to parse request headers.
Adding a Grok Processor
1. Select Processor Stage: In your pipeline configuration, locate the stage where you want to add the Grok processor. Typically, this would be after any filters or before any outputs.

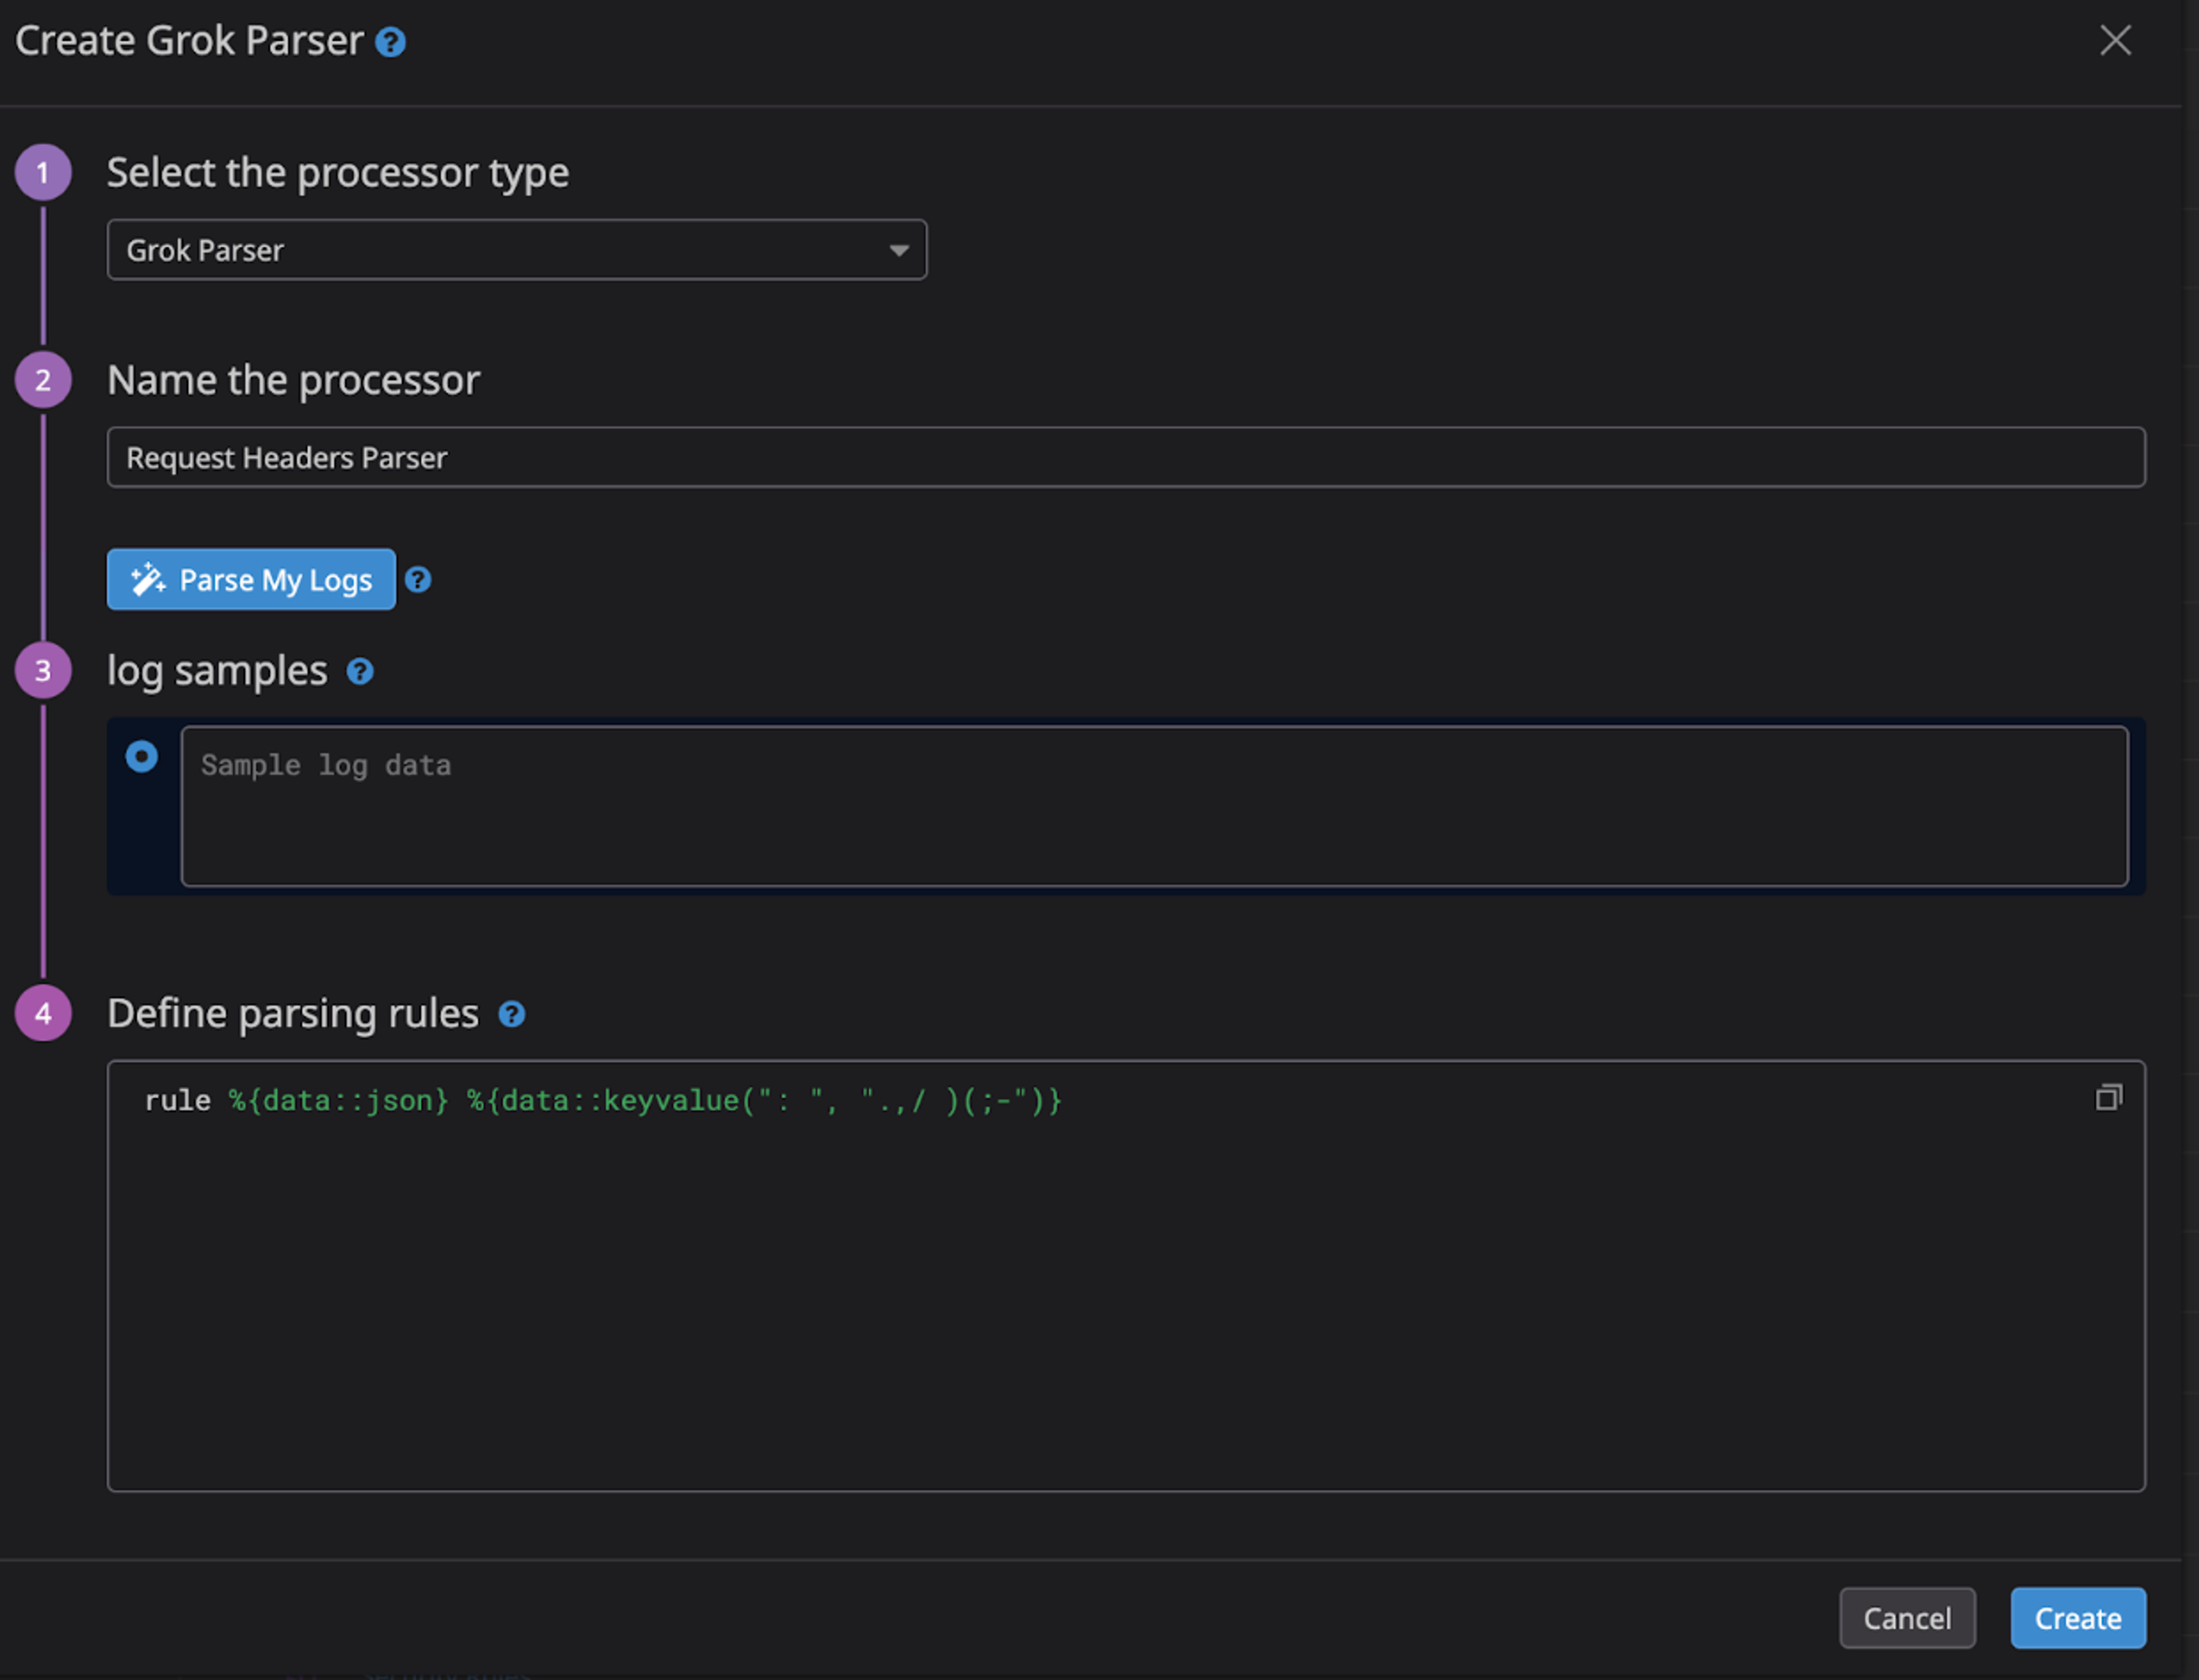
2. Add Grok Processor: Click on "Add Processor" and choose "Grok" from the available options.
3. Define Grok Rule: In the Grok processor settings, specify the parsing rule as follows:
rule %{data::json} %{data::keyvalue(": ", ".,/ )(;-")}This rule instructs the processor to parse the logs using the provided pattern, extracting key-value pairs separated by a colon and space, with allowed characters specified.

4. Save Configuration: Once you've defined the Grok processor with the parsing rule, save the pipeline configuration.
Utilizing Parsed Logs to Create Facets
1. Access Log Explorer: Navigate to the Log Explorer in Datadog.
2. View Parsed Logs: Explore the logs ingested into Datadog, and you'll notice that the headers of the requests have been parsed according to the defined Grok rule.
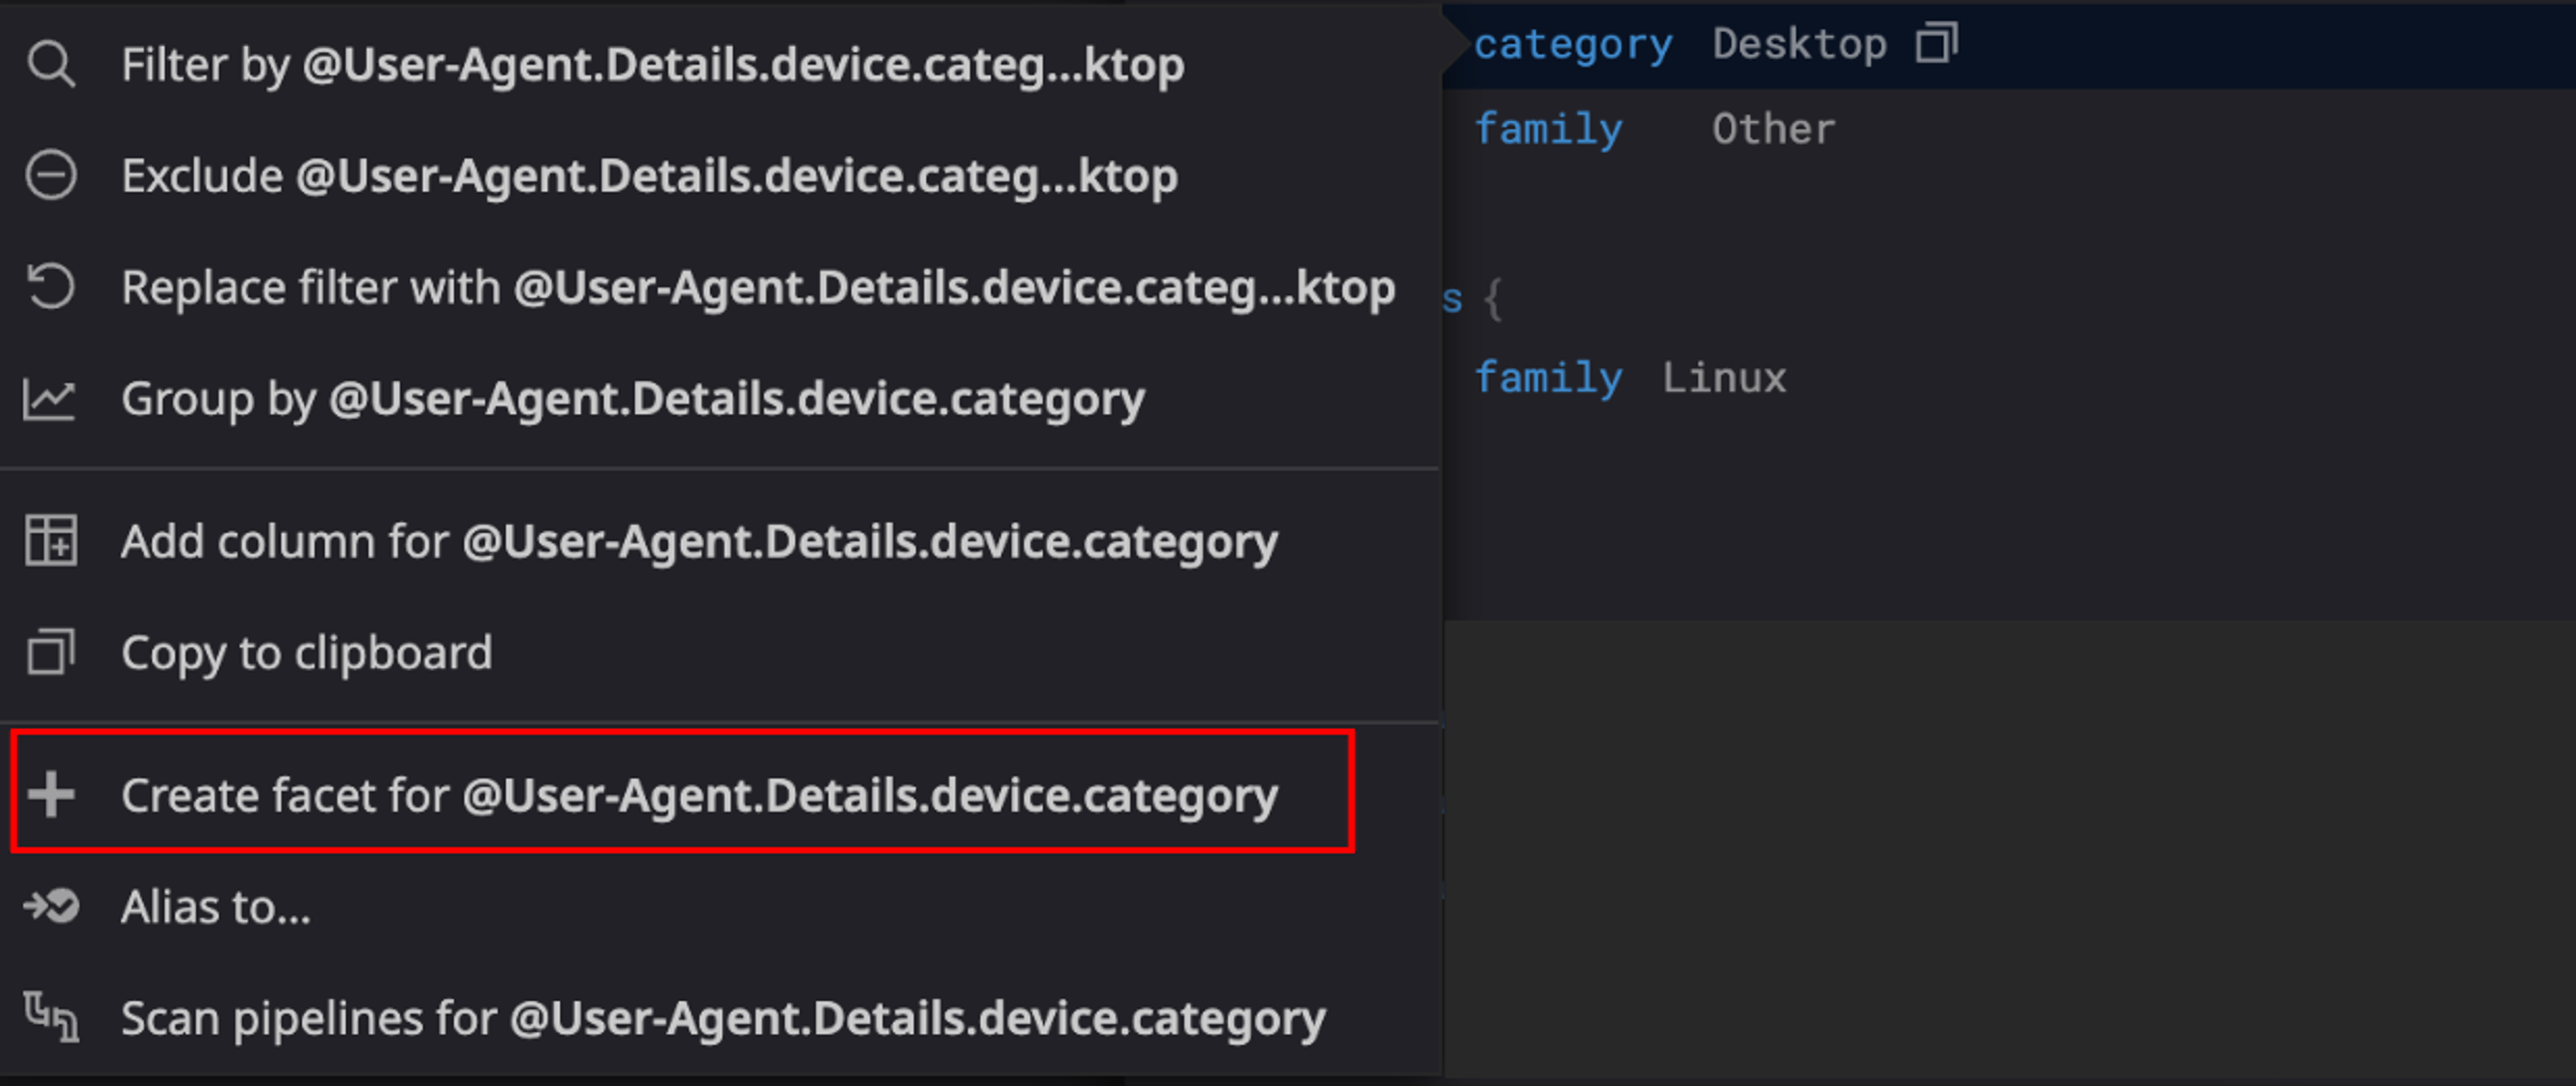
3. Create Facets: To create facets based on the parsed logs, click on the "Facet" button and select the fields you want to use for searching and grouping queries. For example, you can create facets based on specific headers extracted from the logs.

4. Refine Queries with Facets: Utilize the created facets to refine your search and group logs based on different criteria. This allows for more precise analysis and monitoring of your logs.
Exploring Alternative Options
While configuring a Datadog pipeline with a Grok processor offers powerful log parsing capabilities, it's essential to consider alternative approaches that might better suit your requirements. Here are some additional options to explore:
1. Structured Logging
If your application logs are already structured, such as in JSON format, you may opt to ingest them directly into Datadog without additional parsing. Datadog's built-in JSON parsing capabilities can automatically extract fields from structured logs, simplifying the ingestion process.
2. Custom Log Parsers
For more complex parsing requirements, consider writing custom log parsers using scripting languages like Python or JavaScript. These parsers can extract specific fields from your log data and format them as needed before sending them to Datadog for analysis.
3. AWS CloudWatch Logs Insights
If you're using AWS services, CloudWatch Logs Insights provides a convenient platform for querying and analyzing log data. With its SQL-like query language, you can filter, aggregate, and extract fields from log data directly within the CloudWatch console, making it a compelling option for AWS users.
Conclusion
Configuring a Datadog pipeline with a Grok processor for parsing request headers enables you to effectively extract structured data from your logs. By leveraging the parsed logs to create facets, you can streamline your log analysis process, making it easier to search, filter, and group logs based on various attributes. This enhances visibility into your system's behavior and facilitates troubleshooting and performance monitoring.


